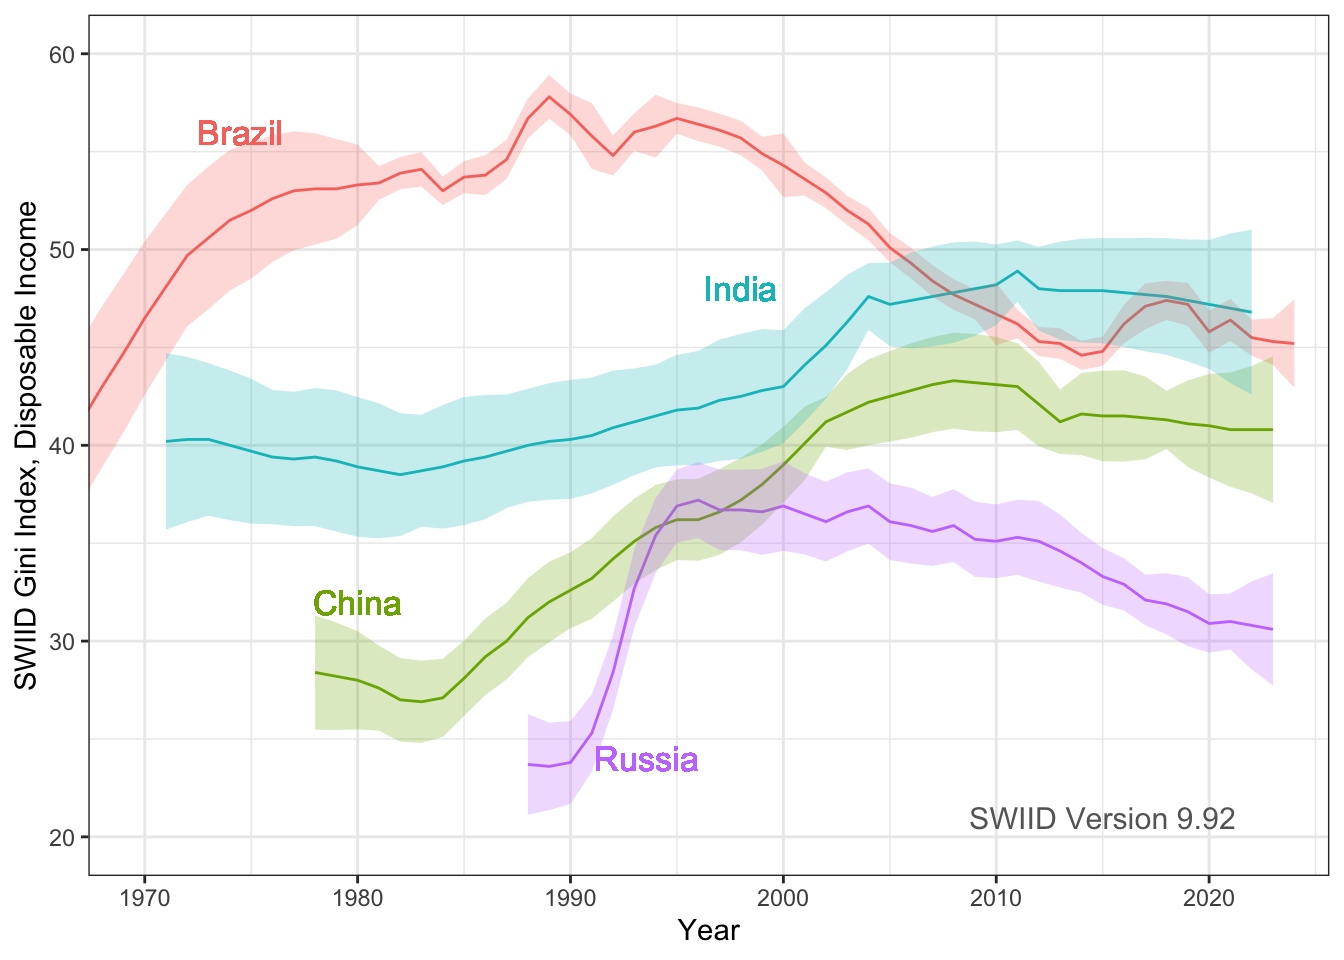
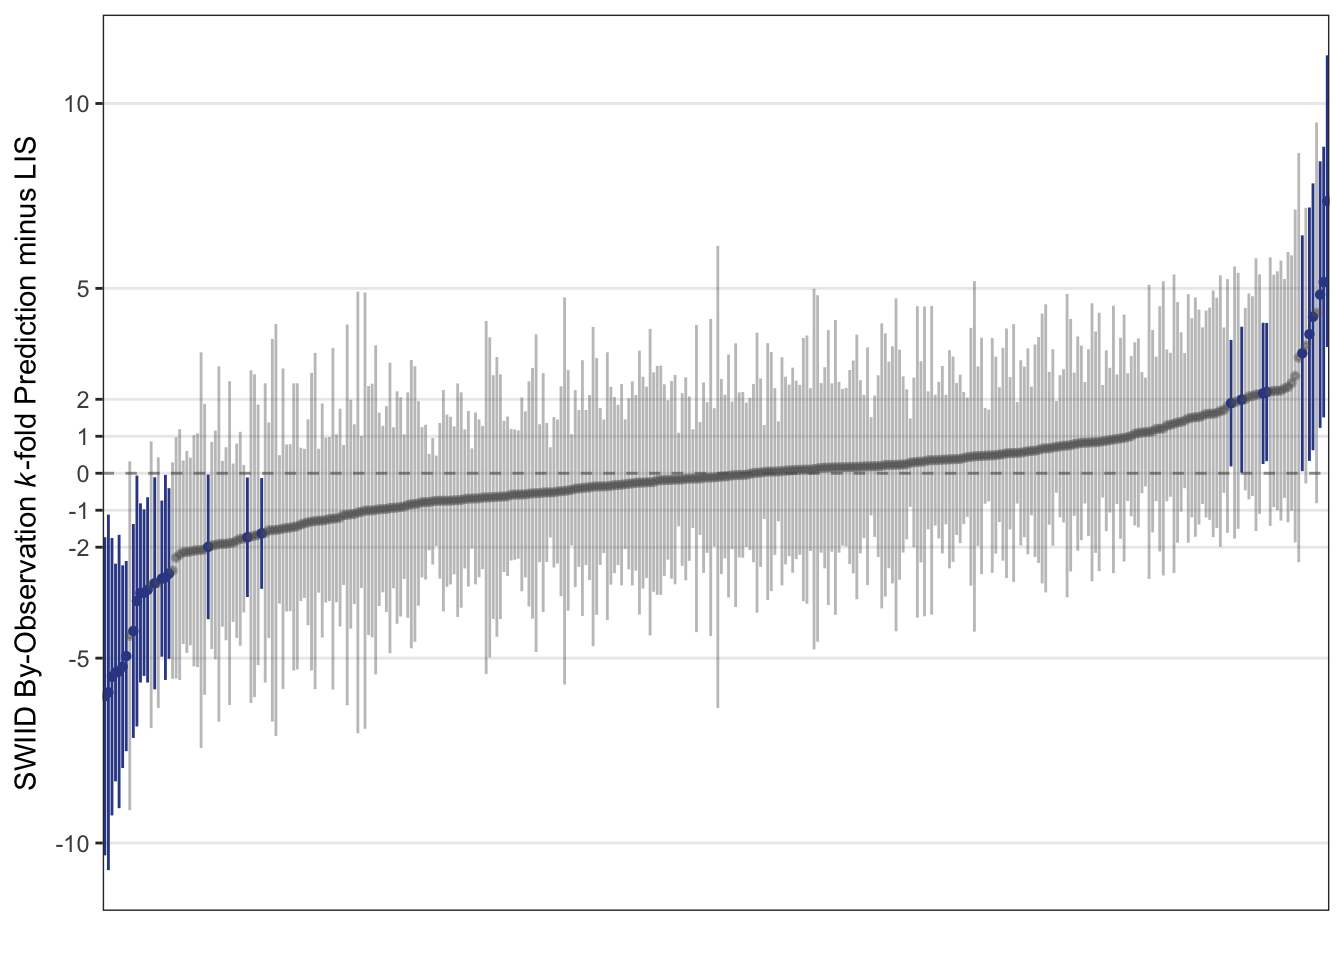
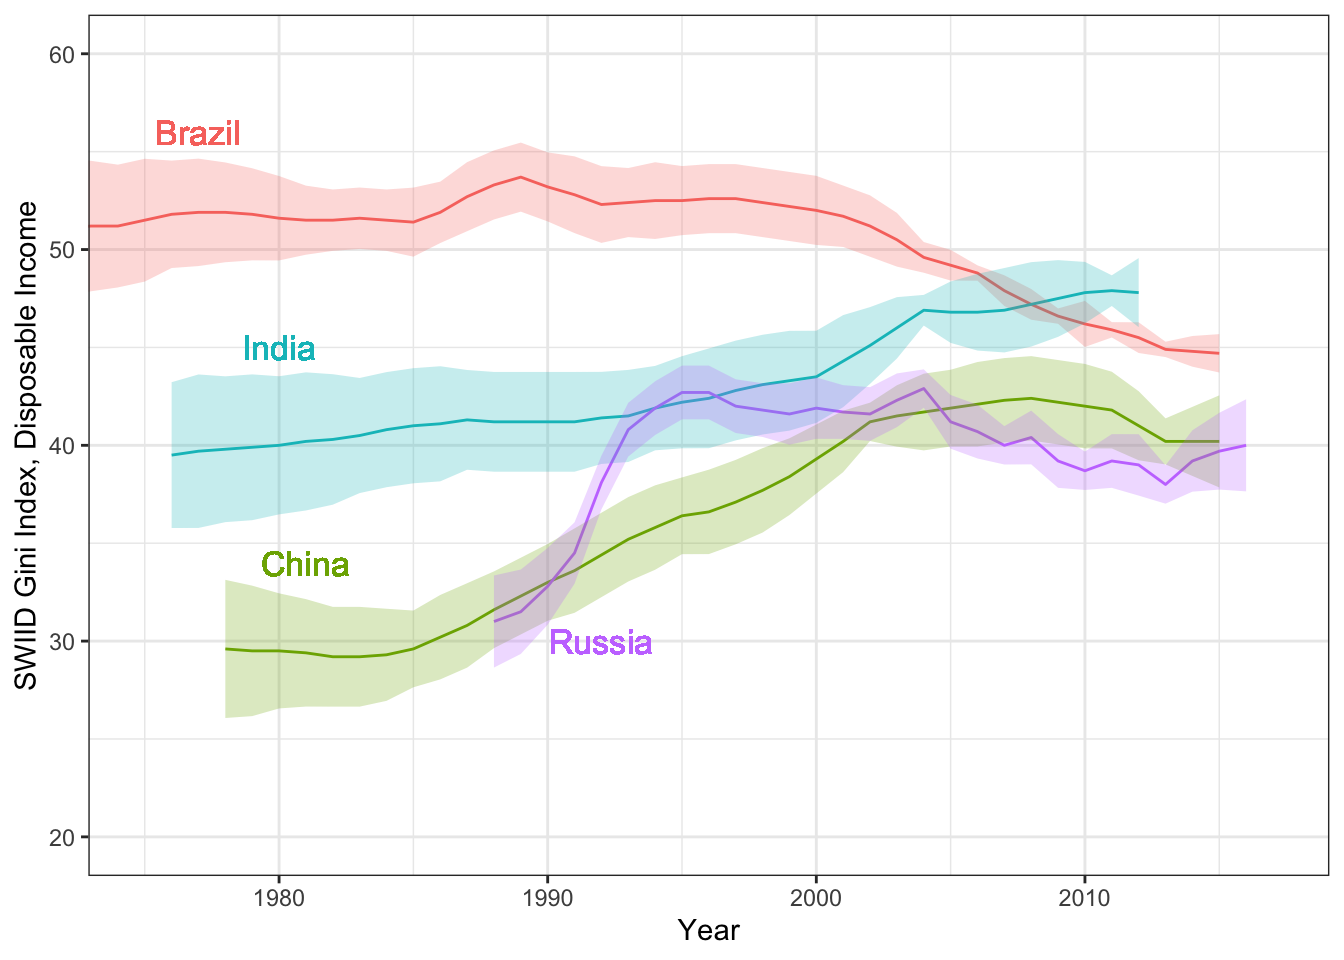
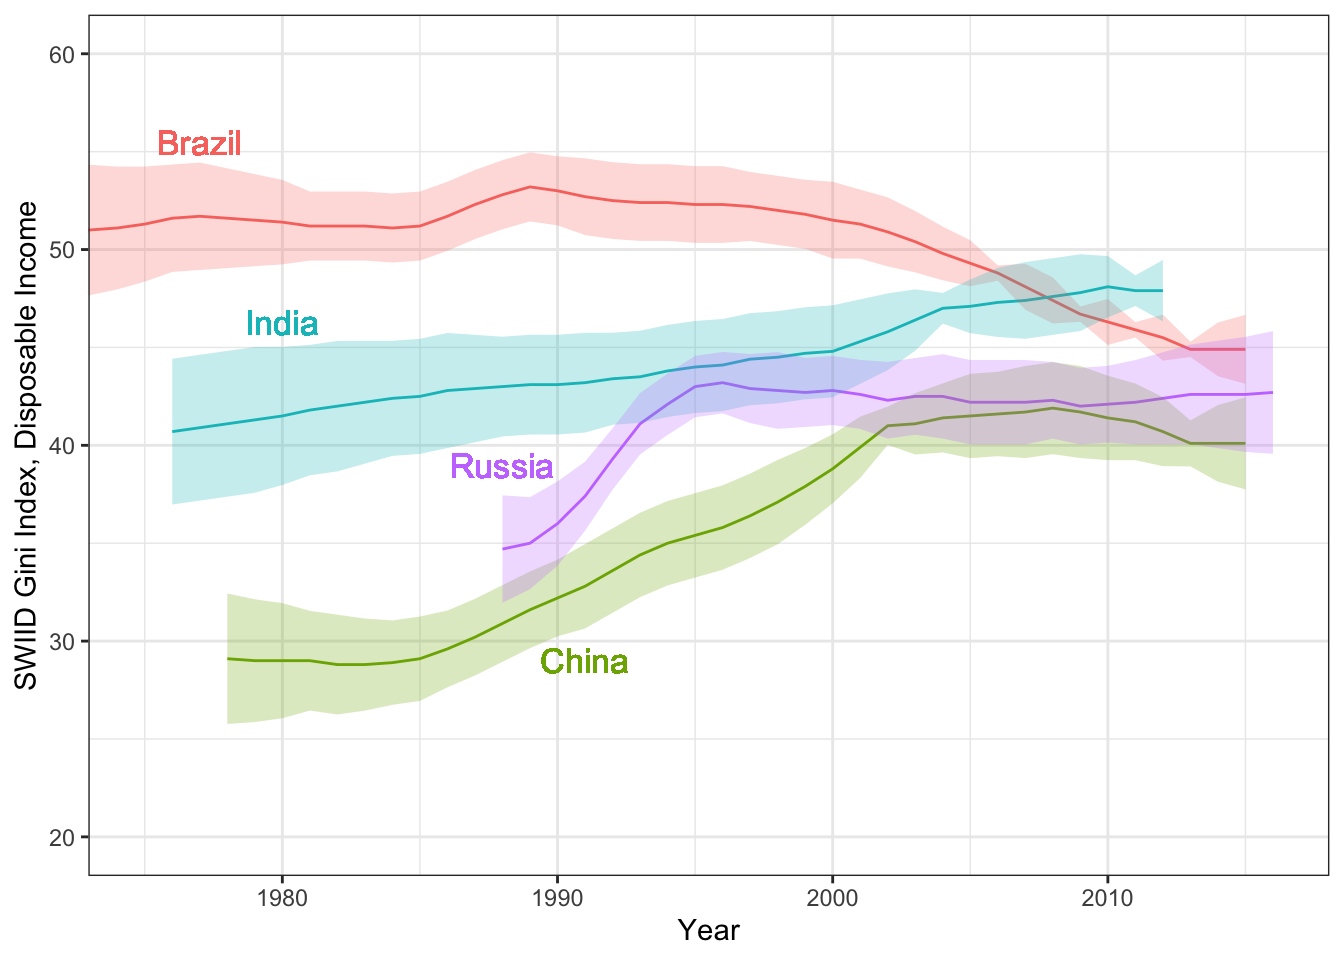
Hi everyone! Version 9.92 of the SWIID is now available! This new release adds to its source data nearly five thousand new Ginis since version…
Hi everyone! Version 9.91 of the SWIID is now available! This new release adds to its source data nearly four thousand new Ginis since version 9.9…
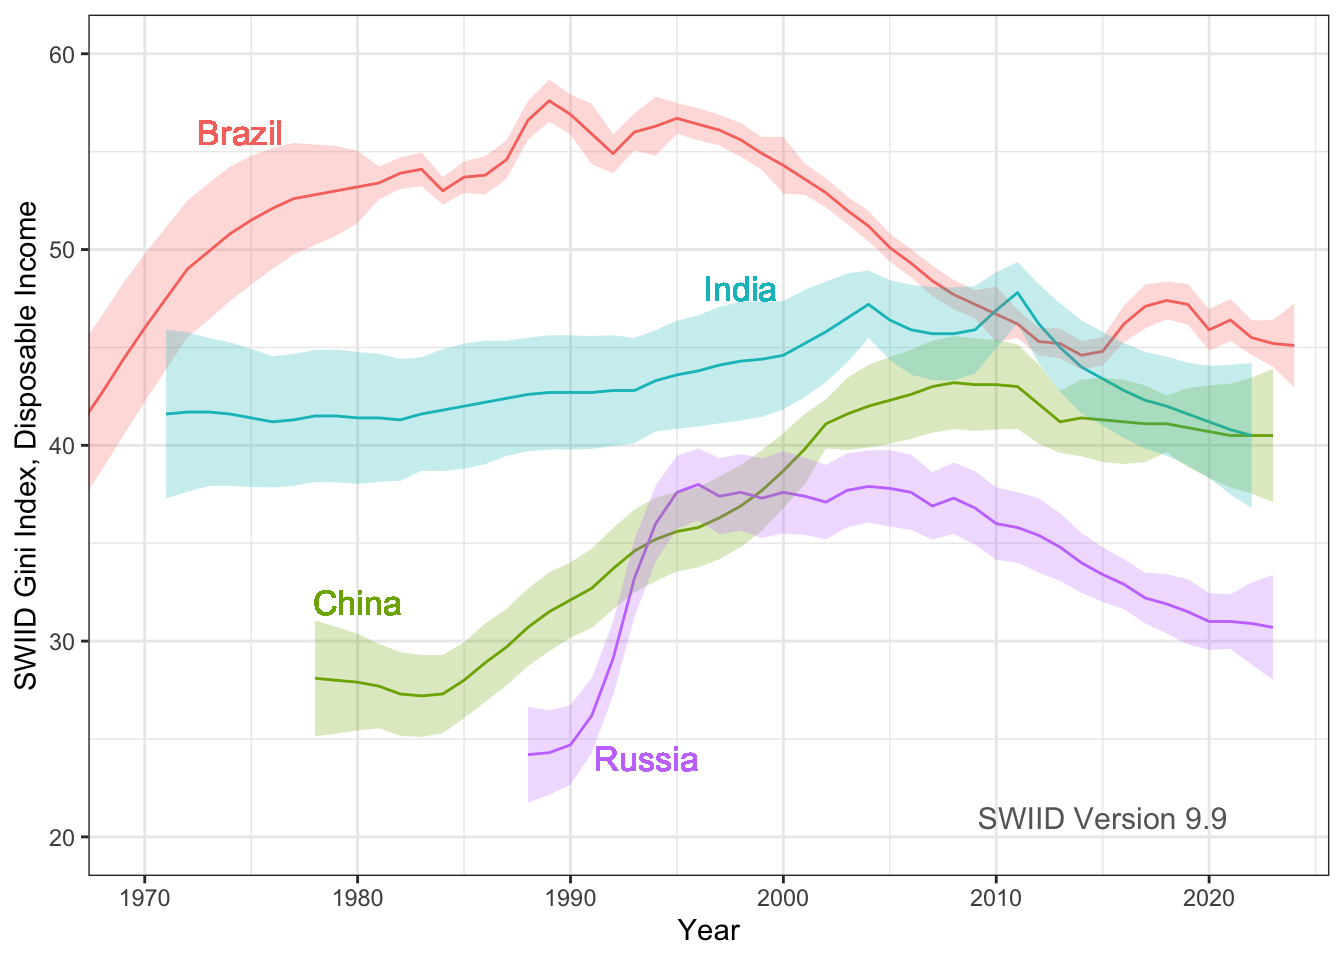
Hi everyone! Version 9.9 of the SWIID is now available! This new release adds to its source data nearly four thousand new Ginis since version 9.8…
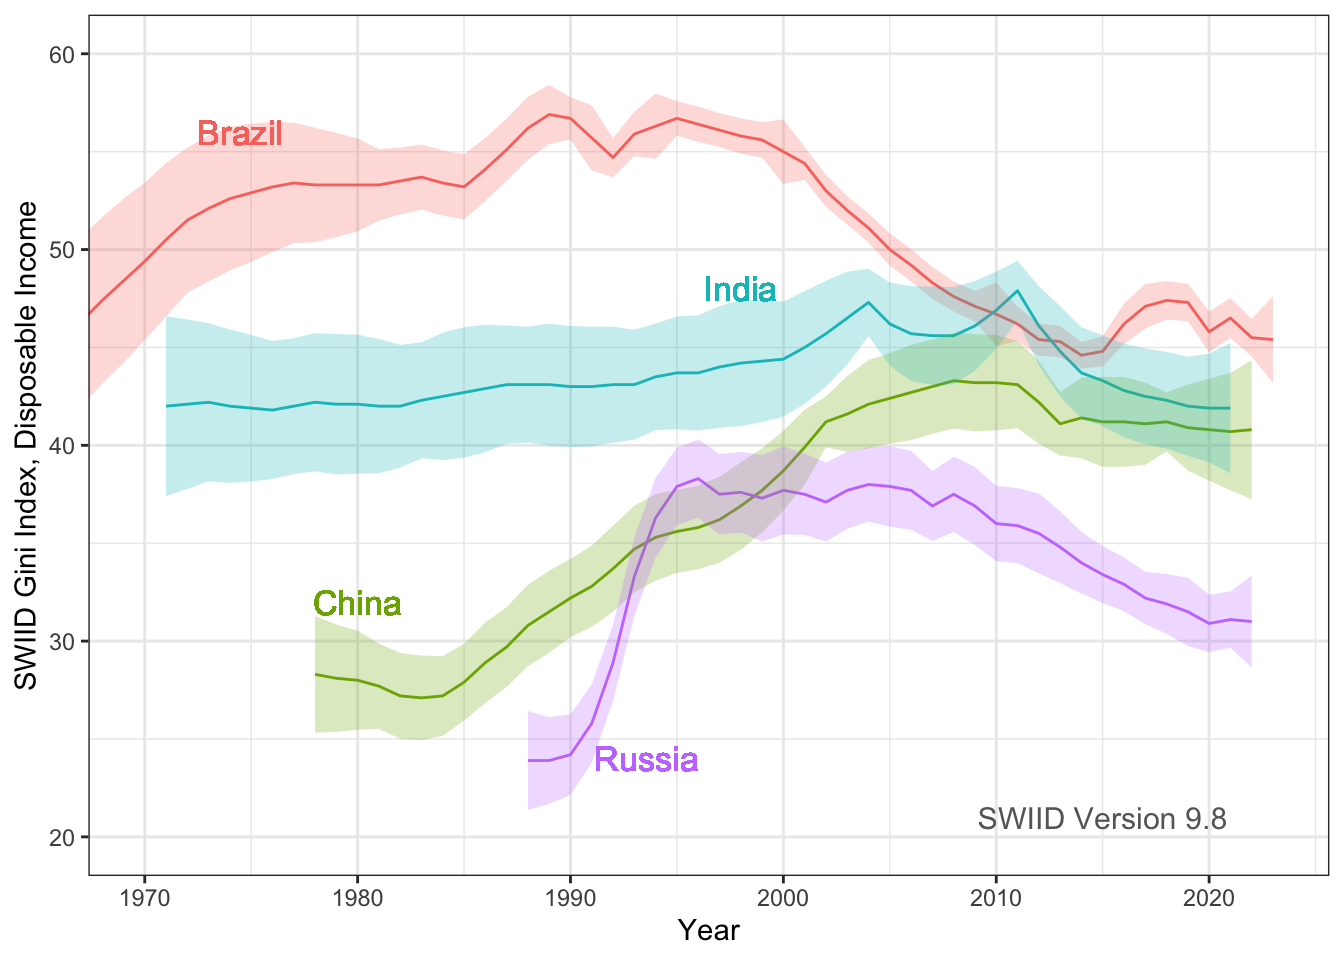
Hi everyone! Version 9.8 of the SWIID is now available! This new release adds to its source data nearly three thousand new Ginis since version 9.7…
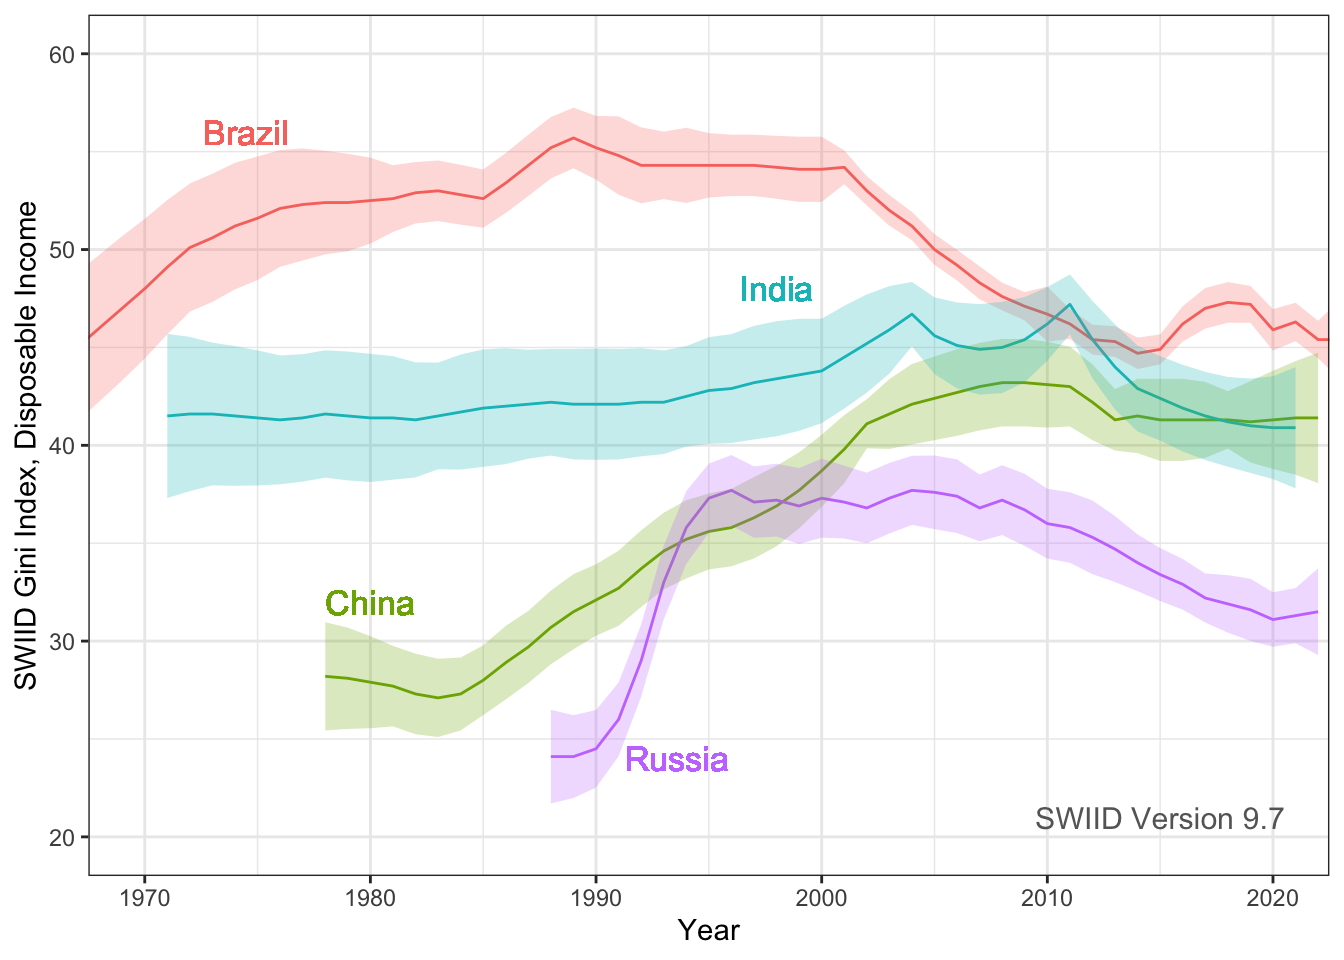
Hi everyone! Version 9.7 of the SWIID is now available! This new release adds to its source data nearly two thousand new Ginis since version 9.6…
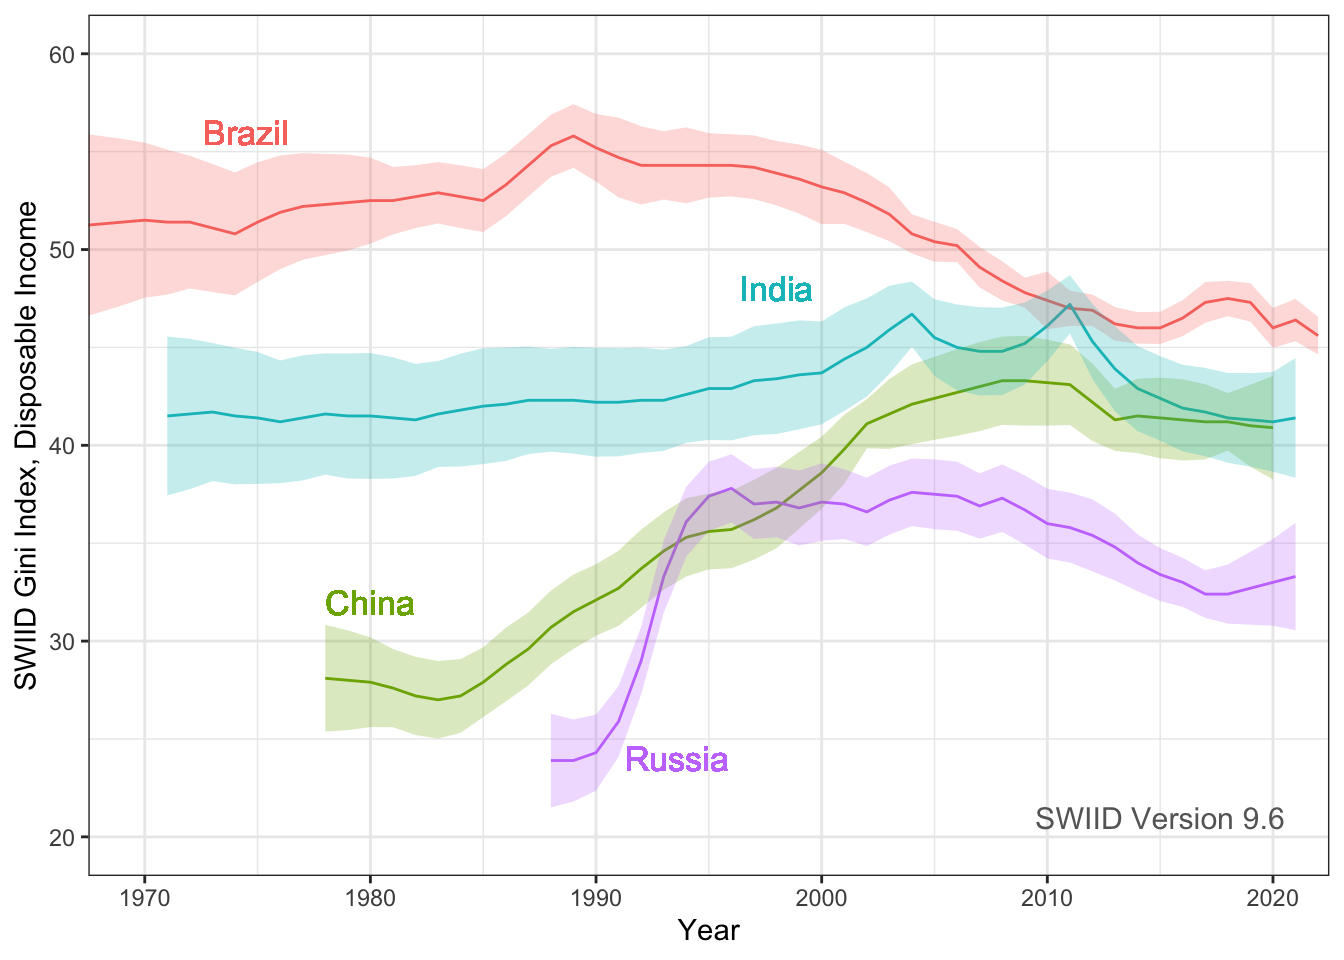
Hi everyone! Version 9.6 of the SWIID is now available! This new release adds to its source data over eight thousand new Ginis since version 9.5…
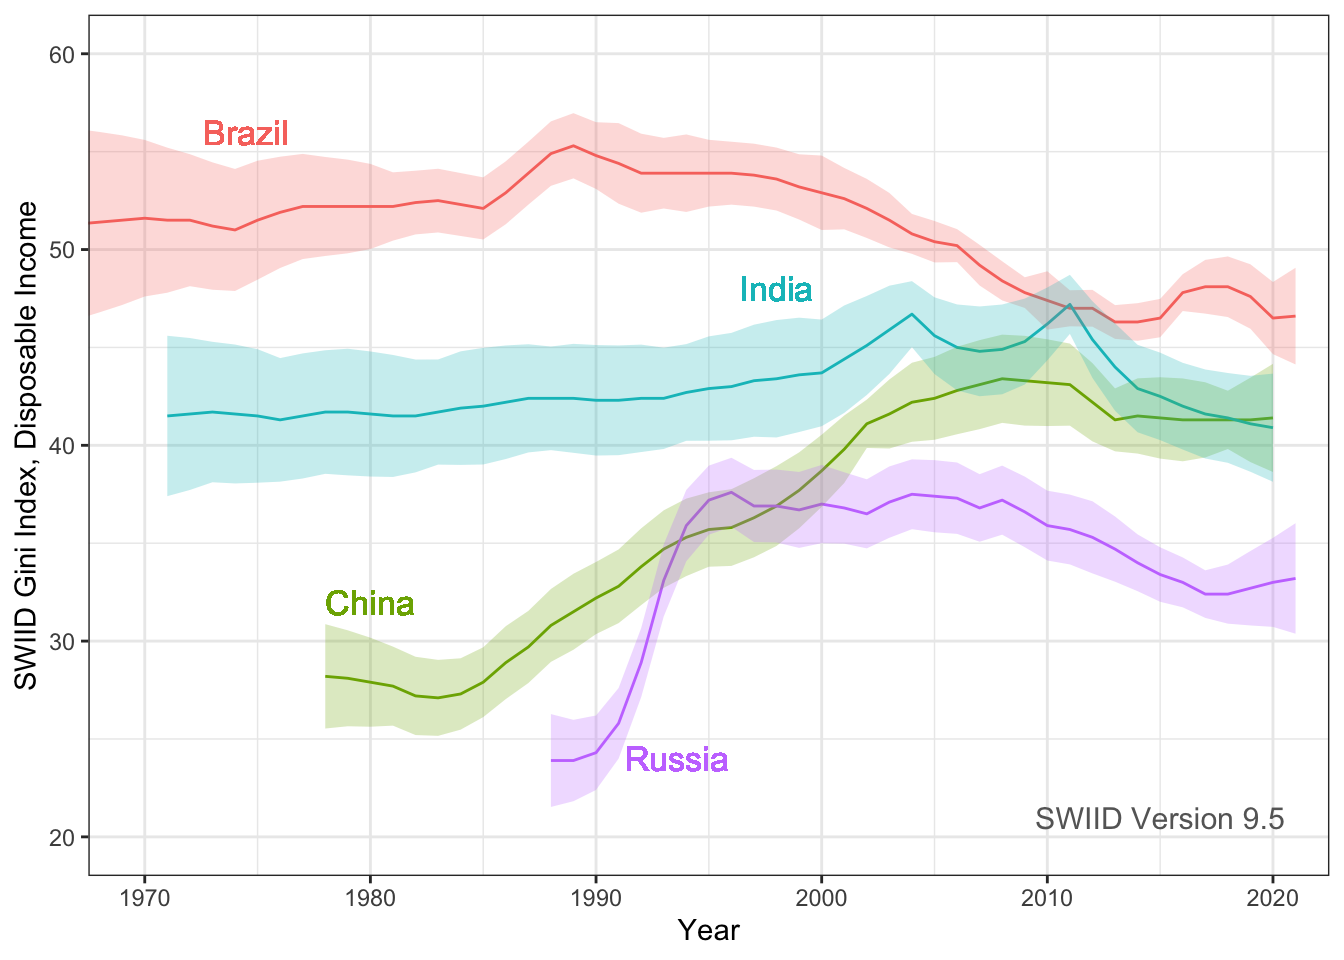
Hi everyone! Version 9.5 of the SWIID is now available! This new release adds to its source data 169 new Ginis since version 9.4…
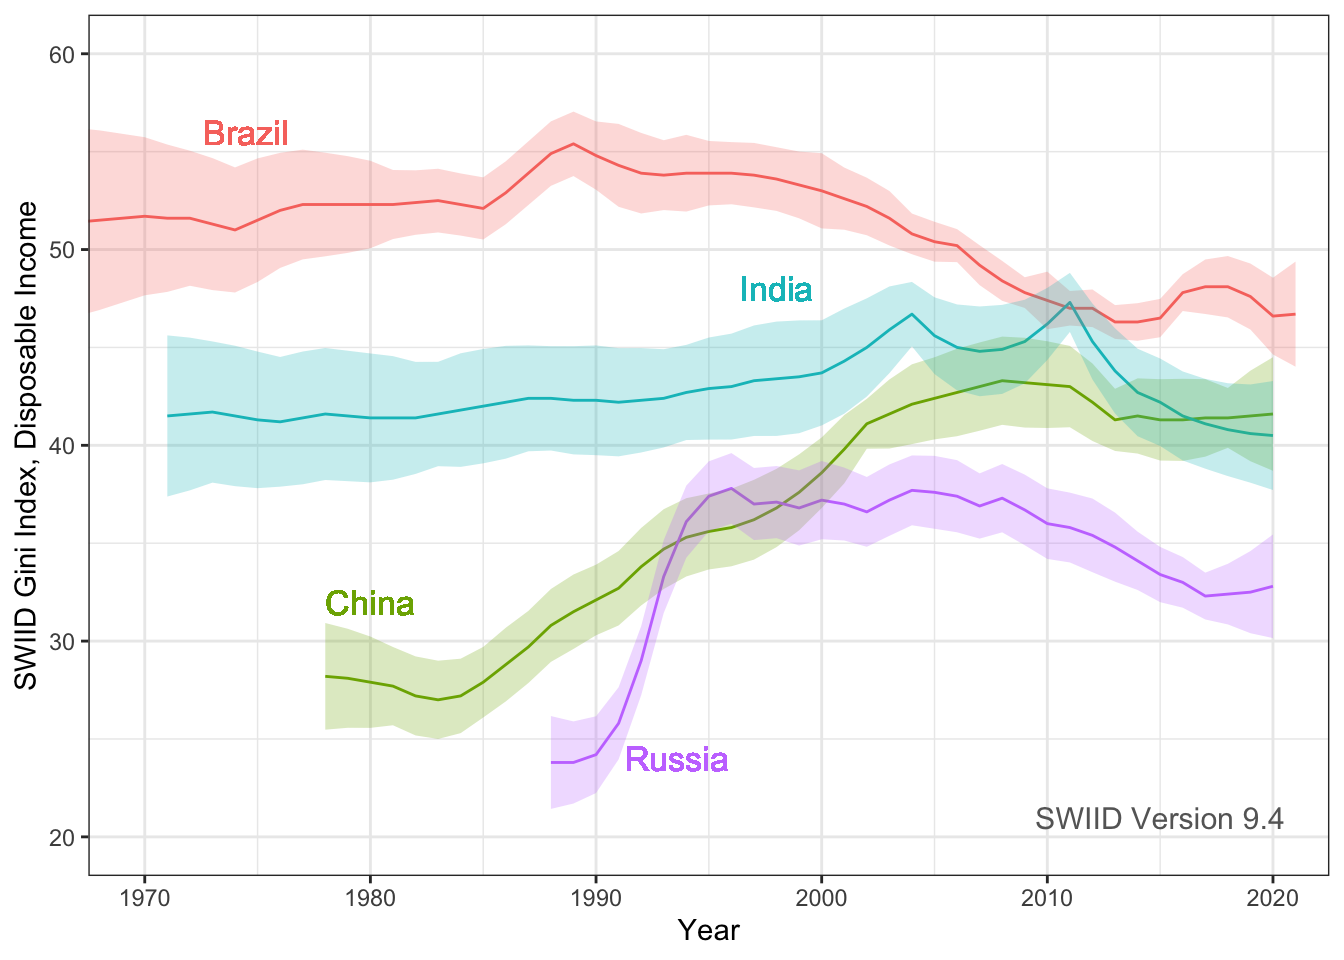
Hi everyone! Version 9.4 of the SWIID is now available! This new release adds to its source data 5494 new Ginis since version 9.3…
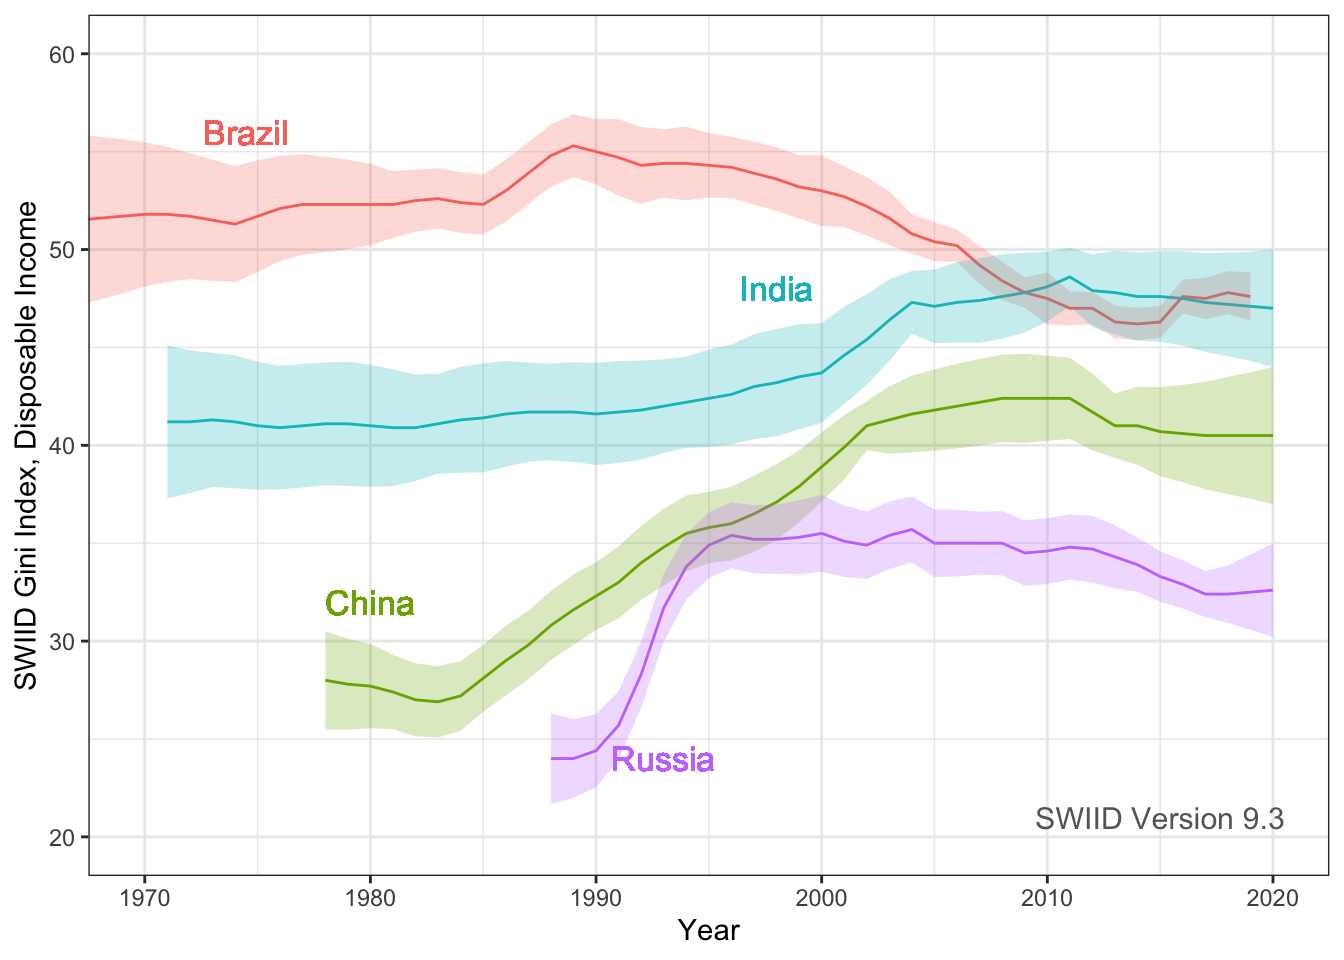
Hi everyone! Version 9.3 of the SWIID is now available! This new release adds to its source data 3834 new Ginis since version 9.2…
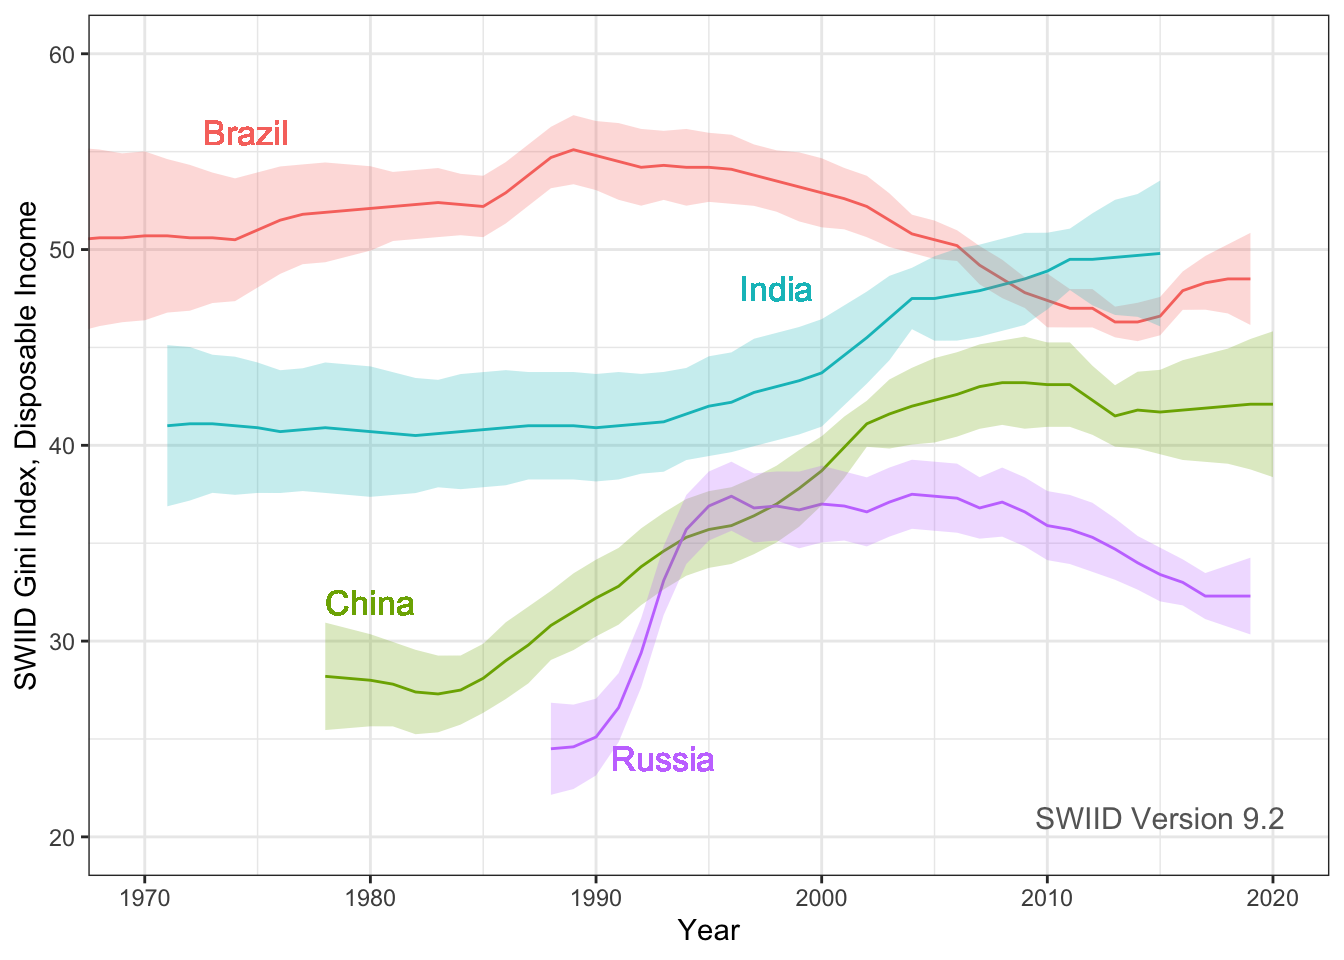
Hi everyone! Version 9.2 of the SWIID is now available! This new release adds to its source data 3834 new Ginis since version 9.1…
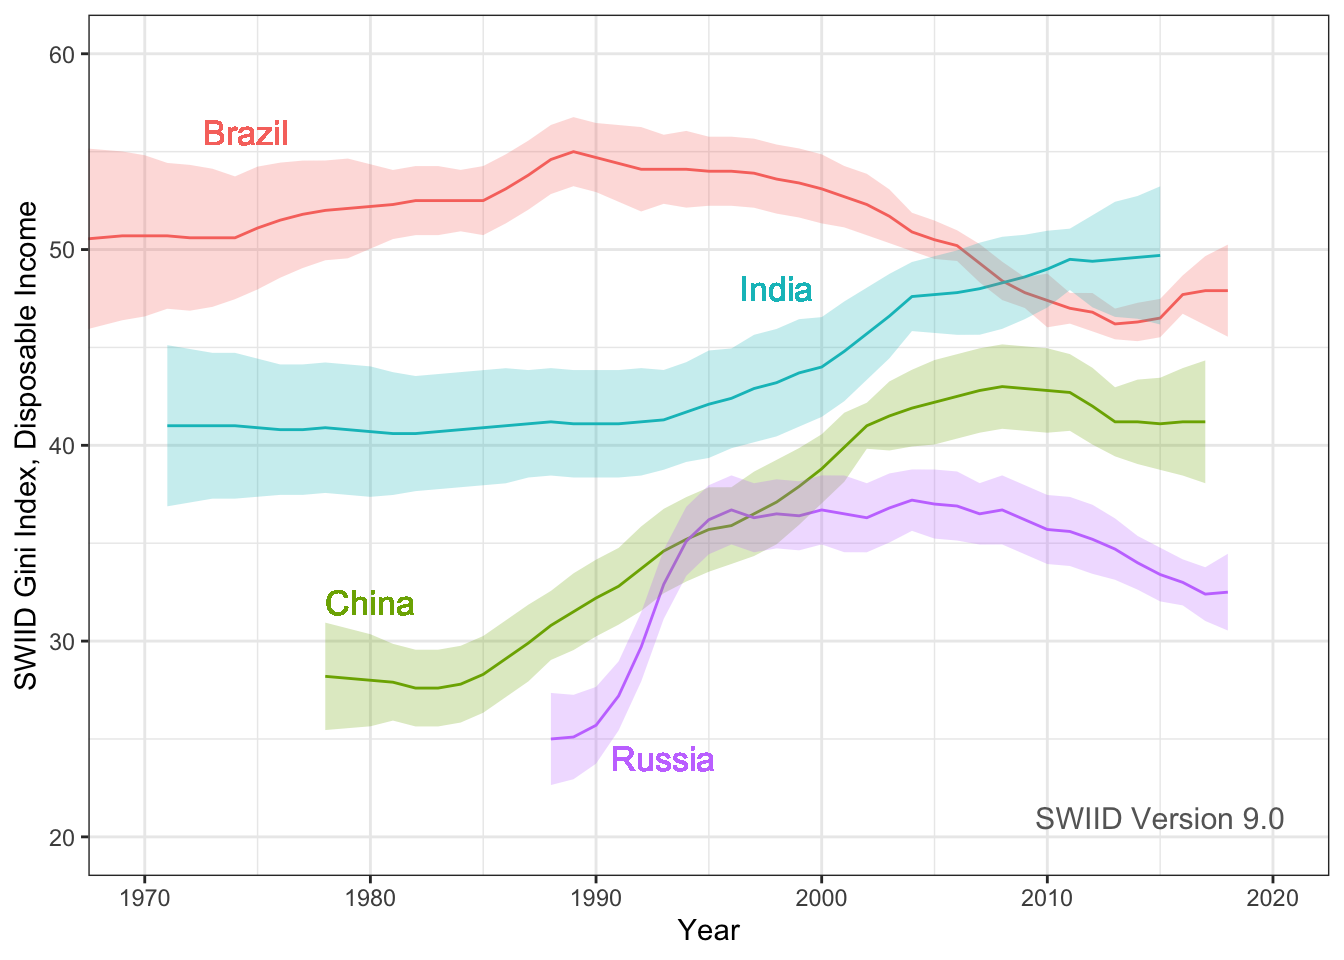
Hi everyone! Version 9.0 of the SWIID is now available! This new release adds to its source data 947 new Ginis since version 8.3…
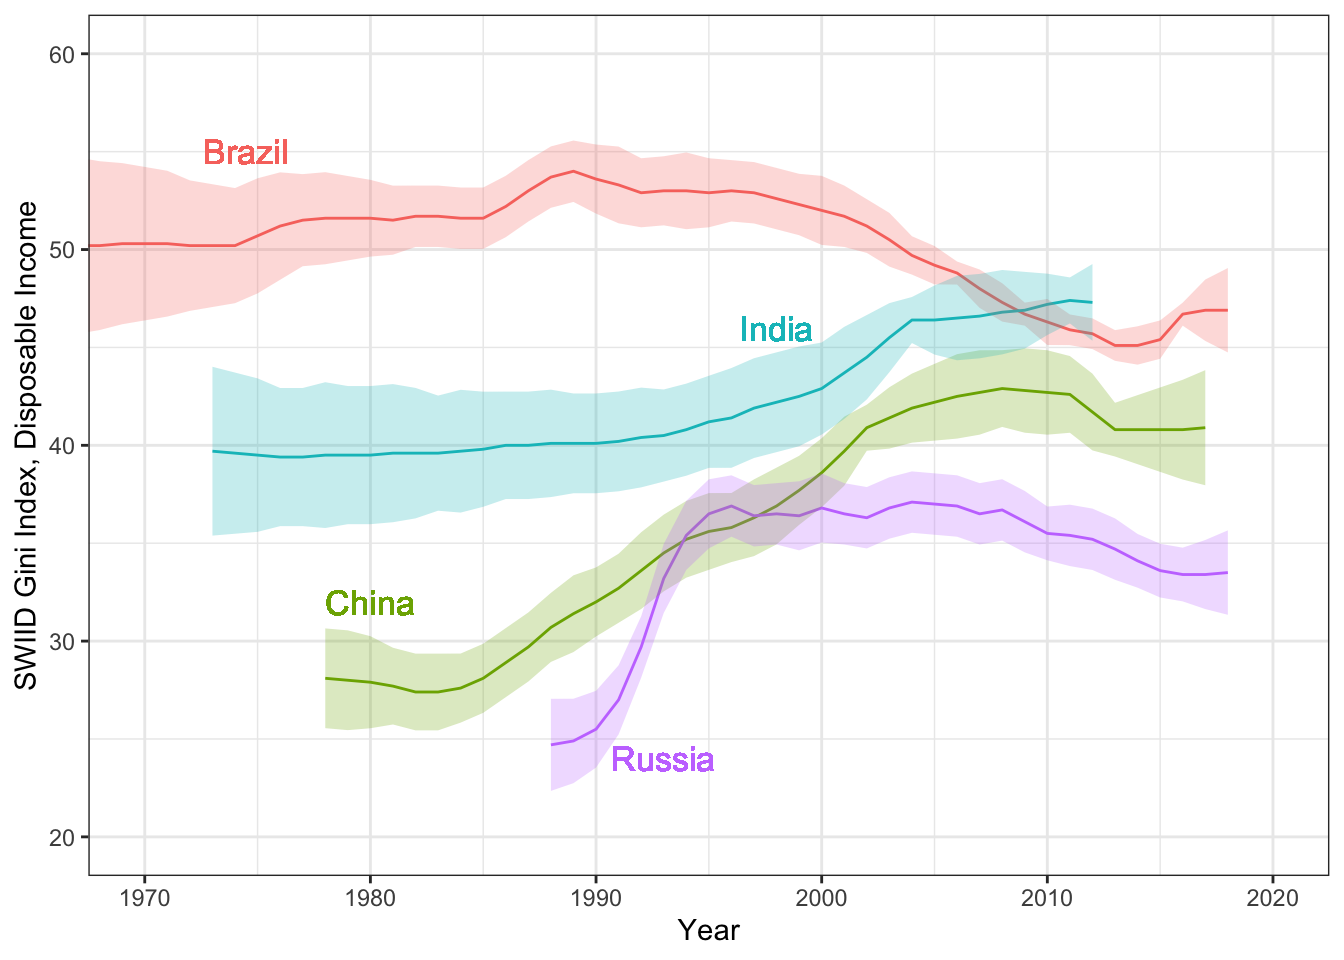
Version 8.3 of the SWIID is now available! This new release adds to its source data 4759 new Ginis since version 8.2…
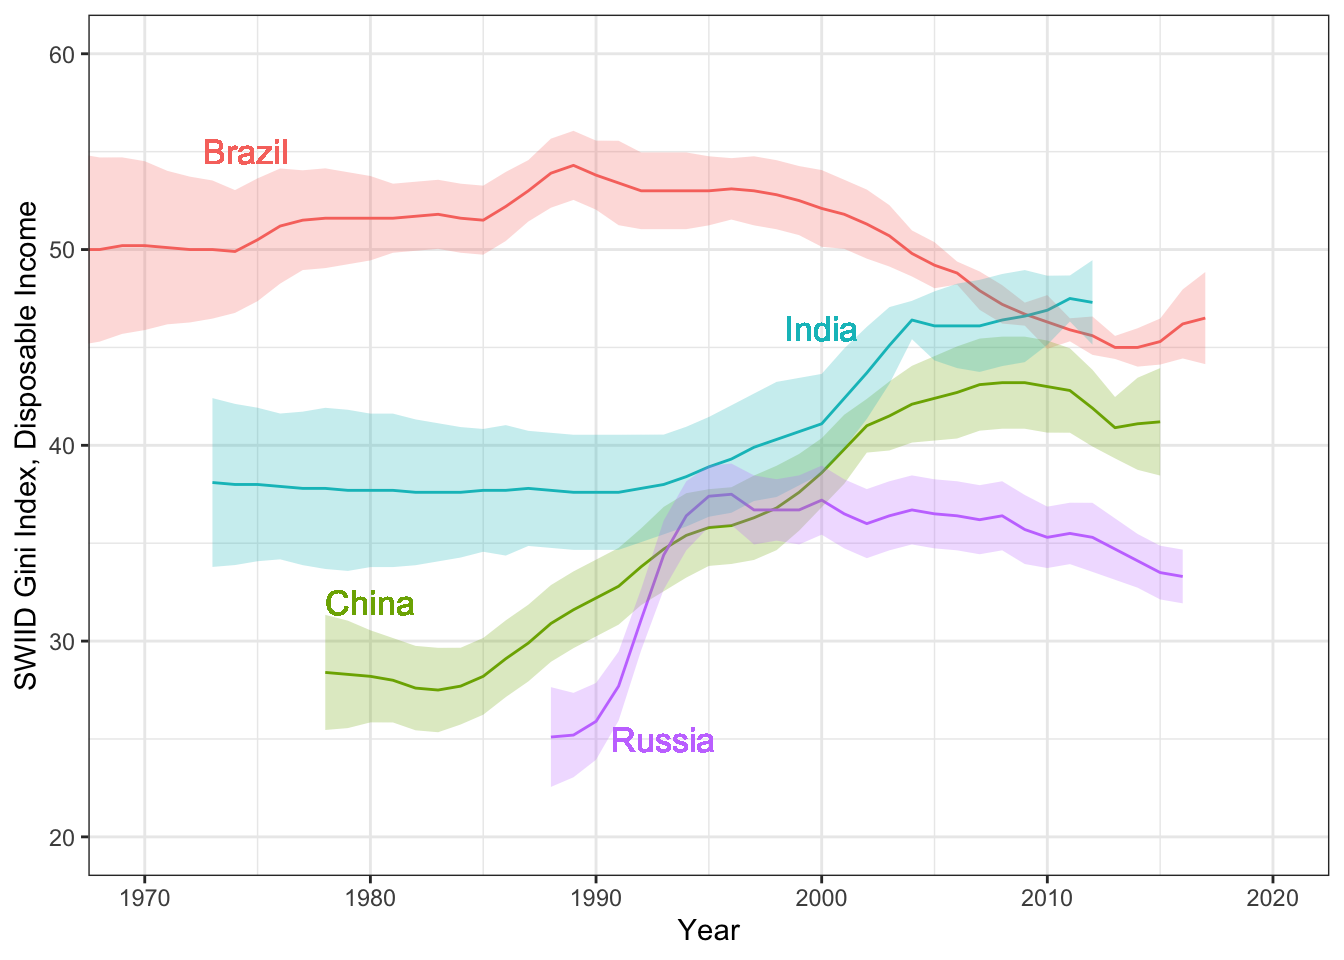
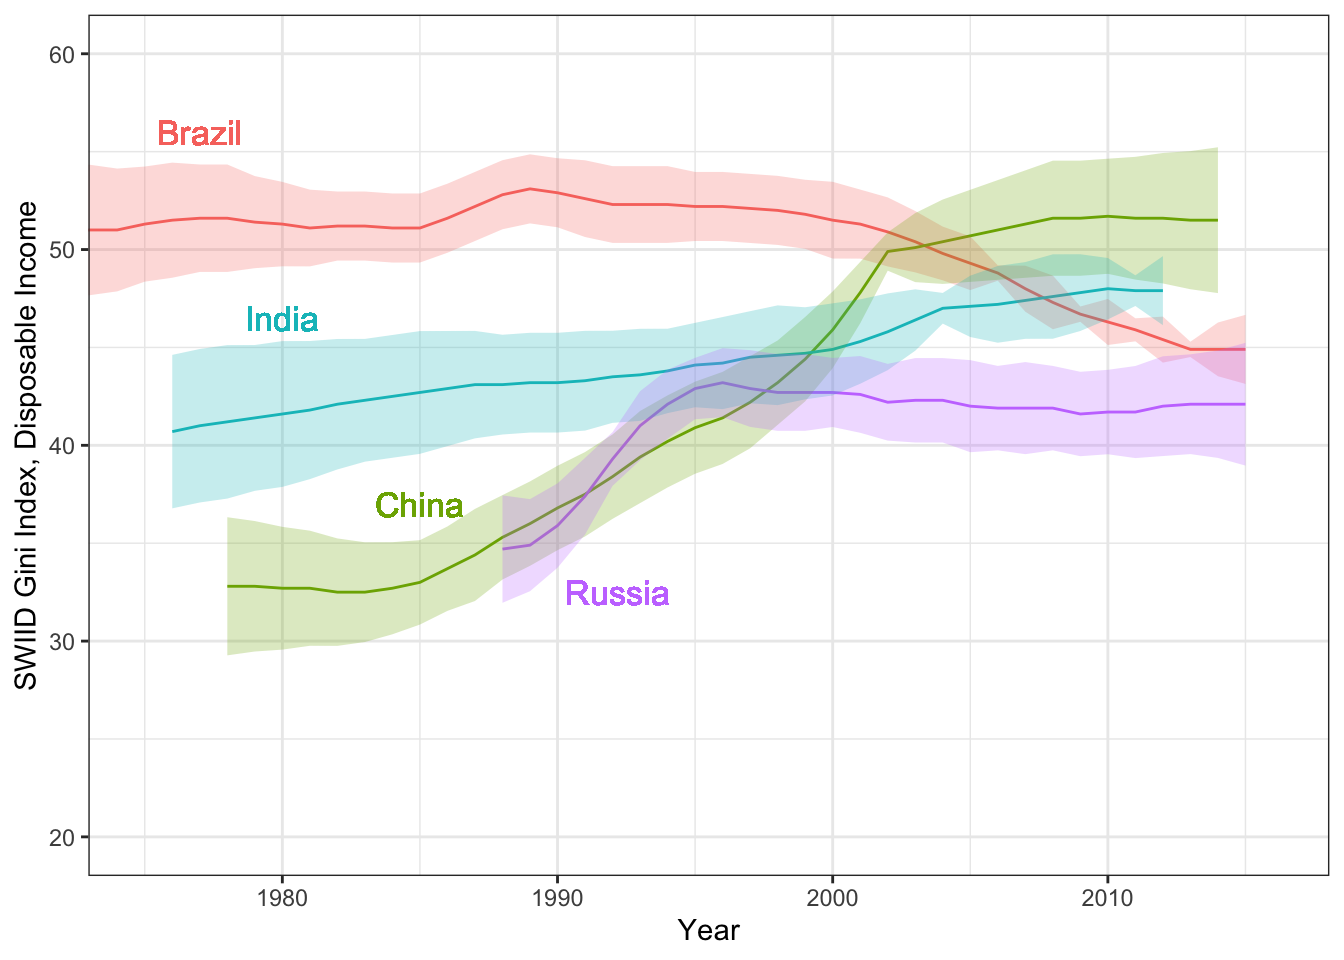
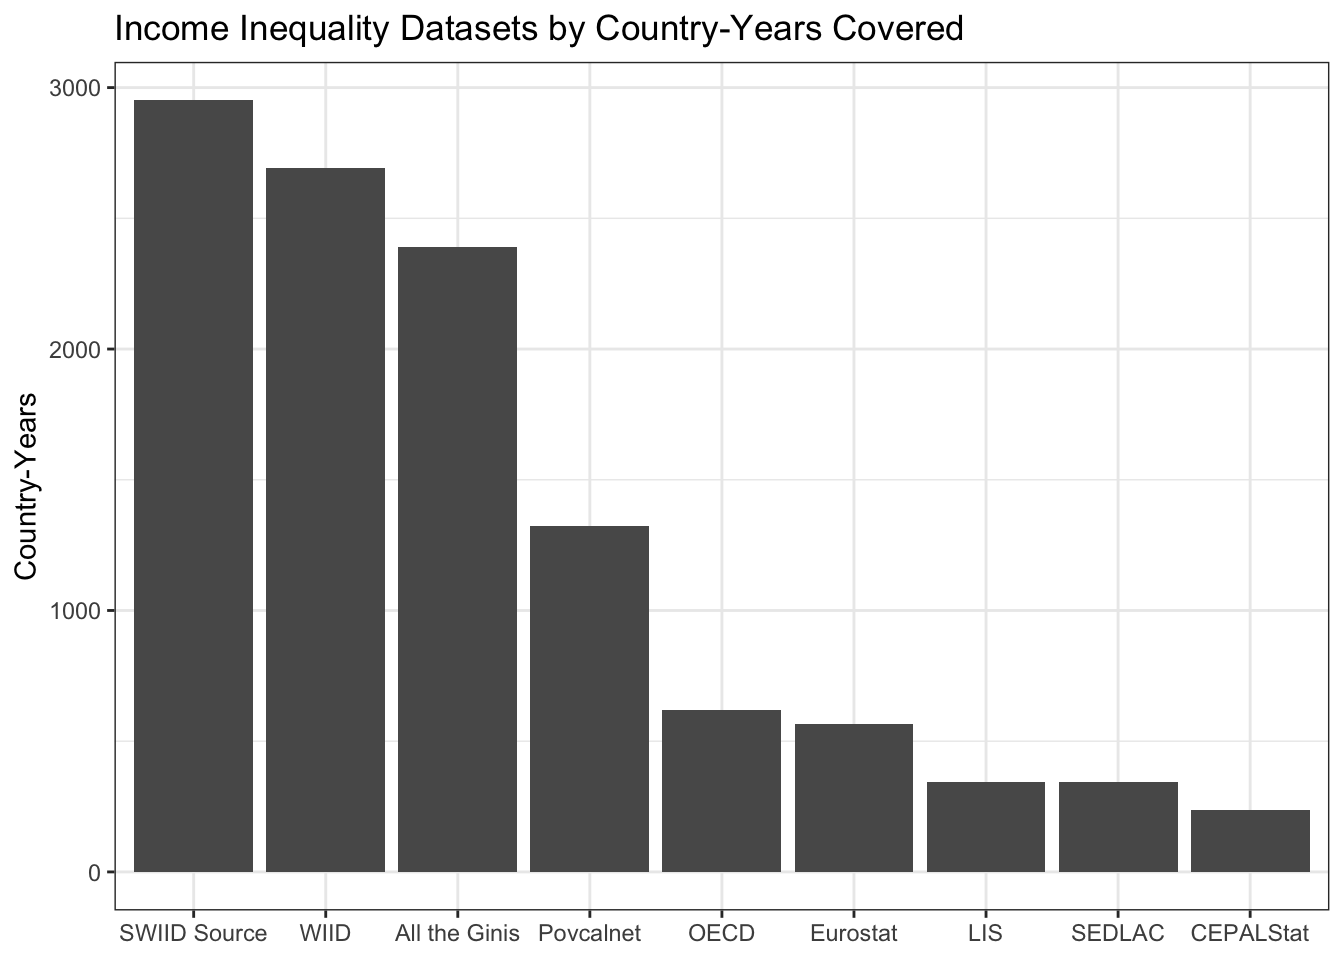
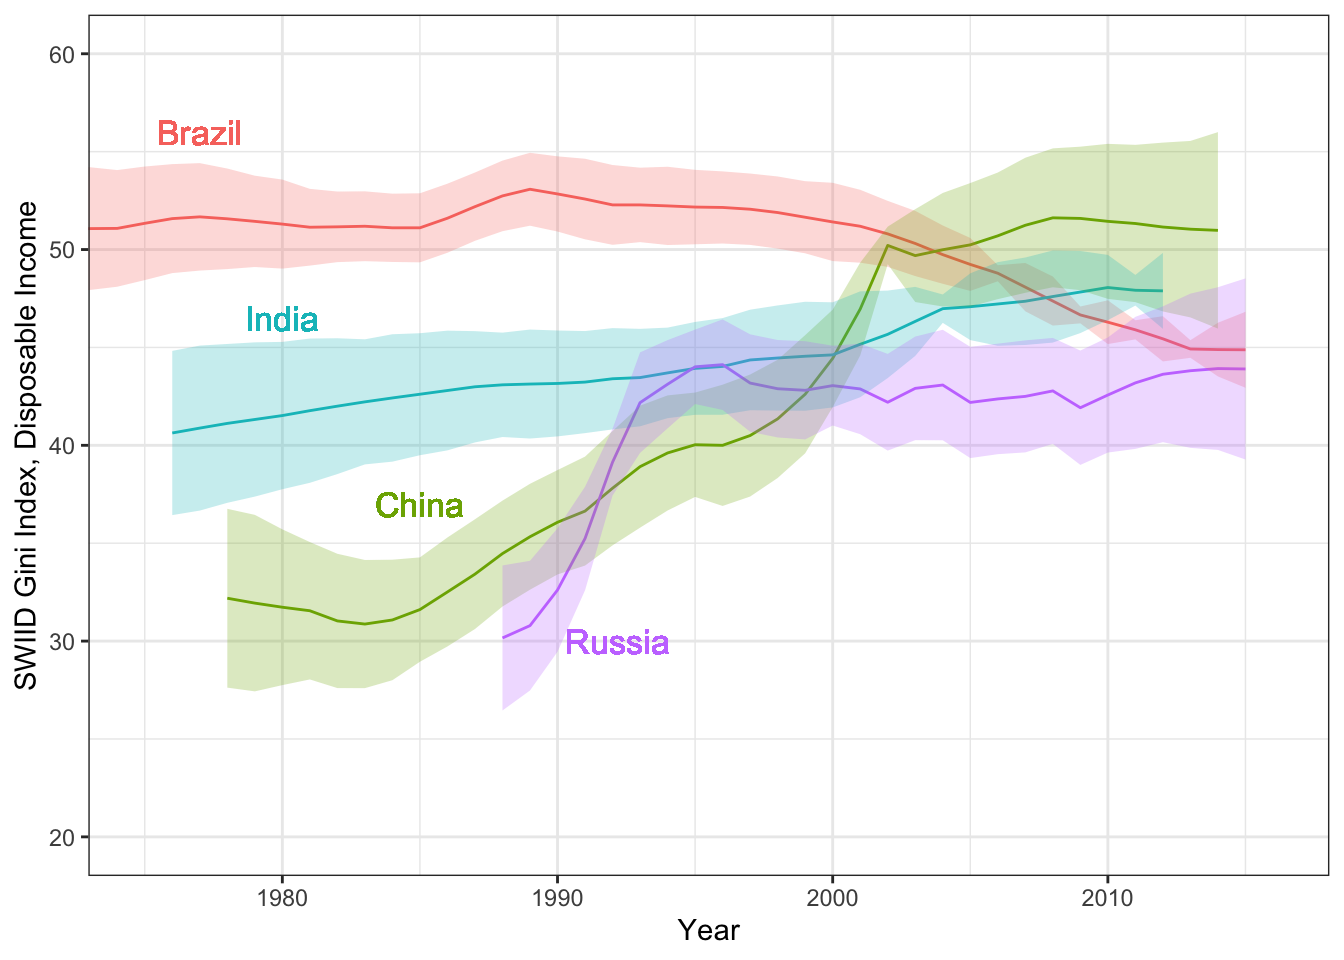
From its origins now over ten years ago, the goal of the Standardized World Income Inequality Database has been to provide estimates of income…
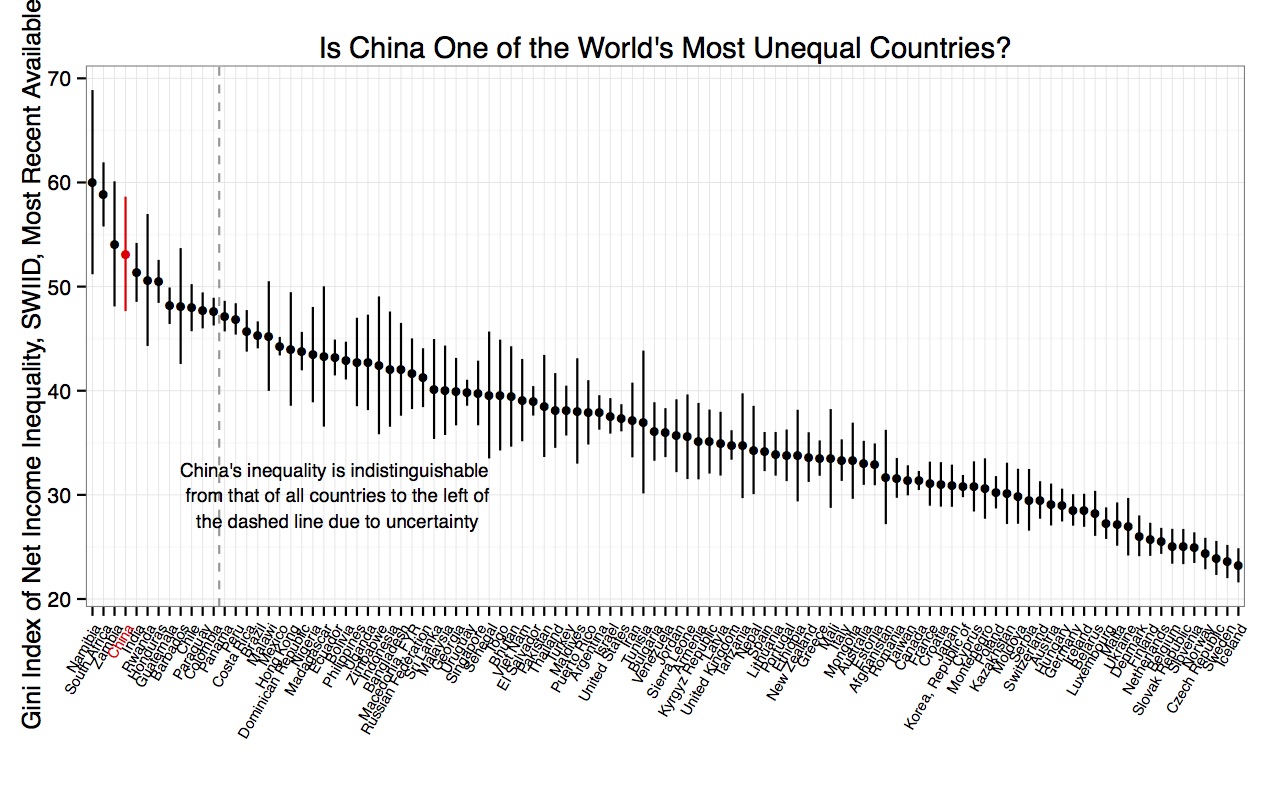
I have been producing the Standardized World Income Inequality Database for nearly a decade. Since 2008, the SWIID has provided estimates of the…
If you use Pew Research Center surveys, you can make your research reproducible with the pewdata package now available…
Hu Yue and I just published interplot on CRAN, our first R package…
Earlier this month, I gave a talk previewing Version 4.0 of the SWIID to the Development Policy and Analysis Division of the…