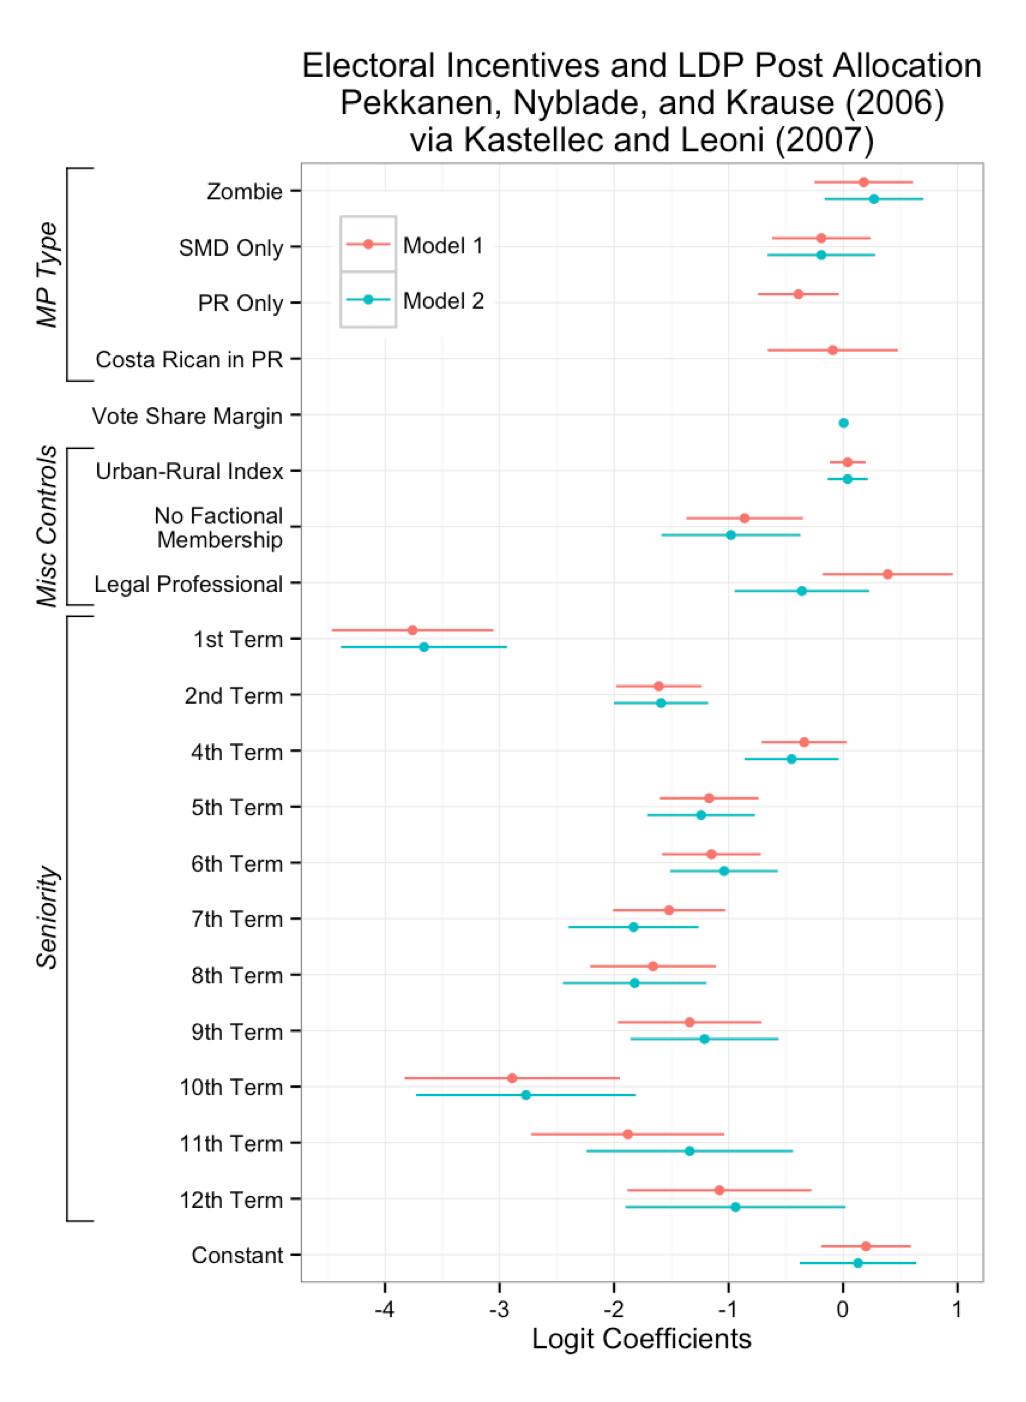
Use dotwhisker for your APSA slides!
note
dotwhisker
r
With the APSA coming up, and in the interest of minimizing the number of times we hear “sorry, I know you won’t really be able to see these regression coefficients,” I thought I’d point R users to dotwhisker, a package UI Ph.D. student Yue HU and I just published to CRAN. dotwhisker makes regression plots in the style of Kastellec and Leoni’s (2007) Perspectives article quick and easy: after data entry, just two lines of R code produced the easy-to-read-even-from-the-back-of-the-room plot attached to this post. I hope you’ll find it useful, and if you have any suggestions for us, that you’ll file an issue at https://github.com/fsolt/dotwhisker, tweet to me @fredericksolt, or just send me an email [email protected].
