Frederick Solt
  • SWIID
  • DCPO
  • Research
  • Teaching
  • Software
  • Blog
  • CV

SWIID Frequently Asked Questions

  • Income Inequality & Its Consequences, Comparative Political Behavior, and Dynamic Comparative Public Opinion

SWIID Frequently Asked Questions

Click on the topic headings to learn more

How to . . .

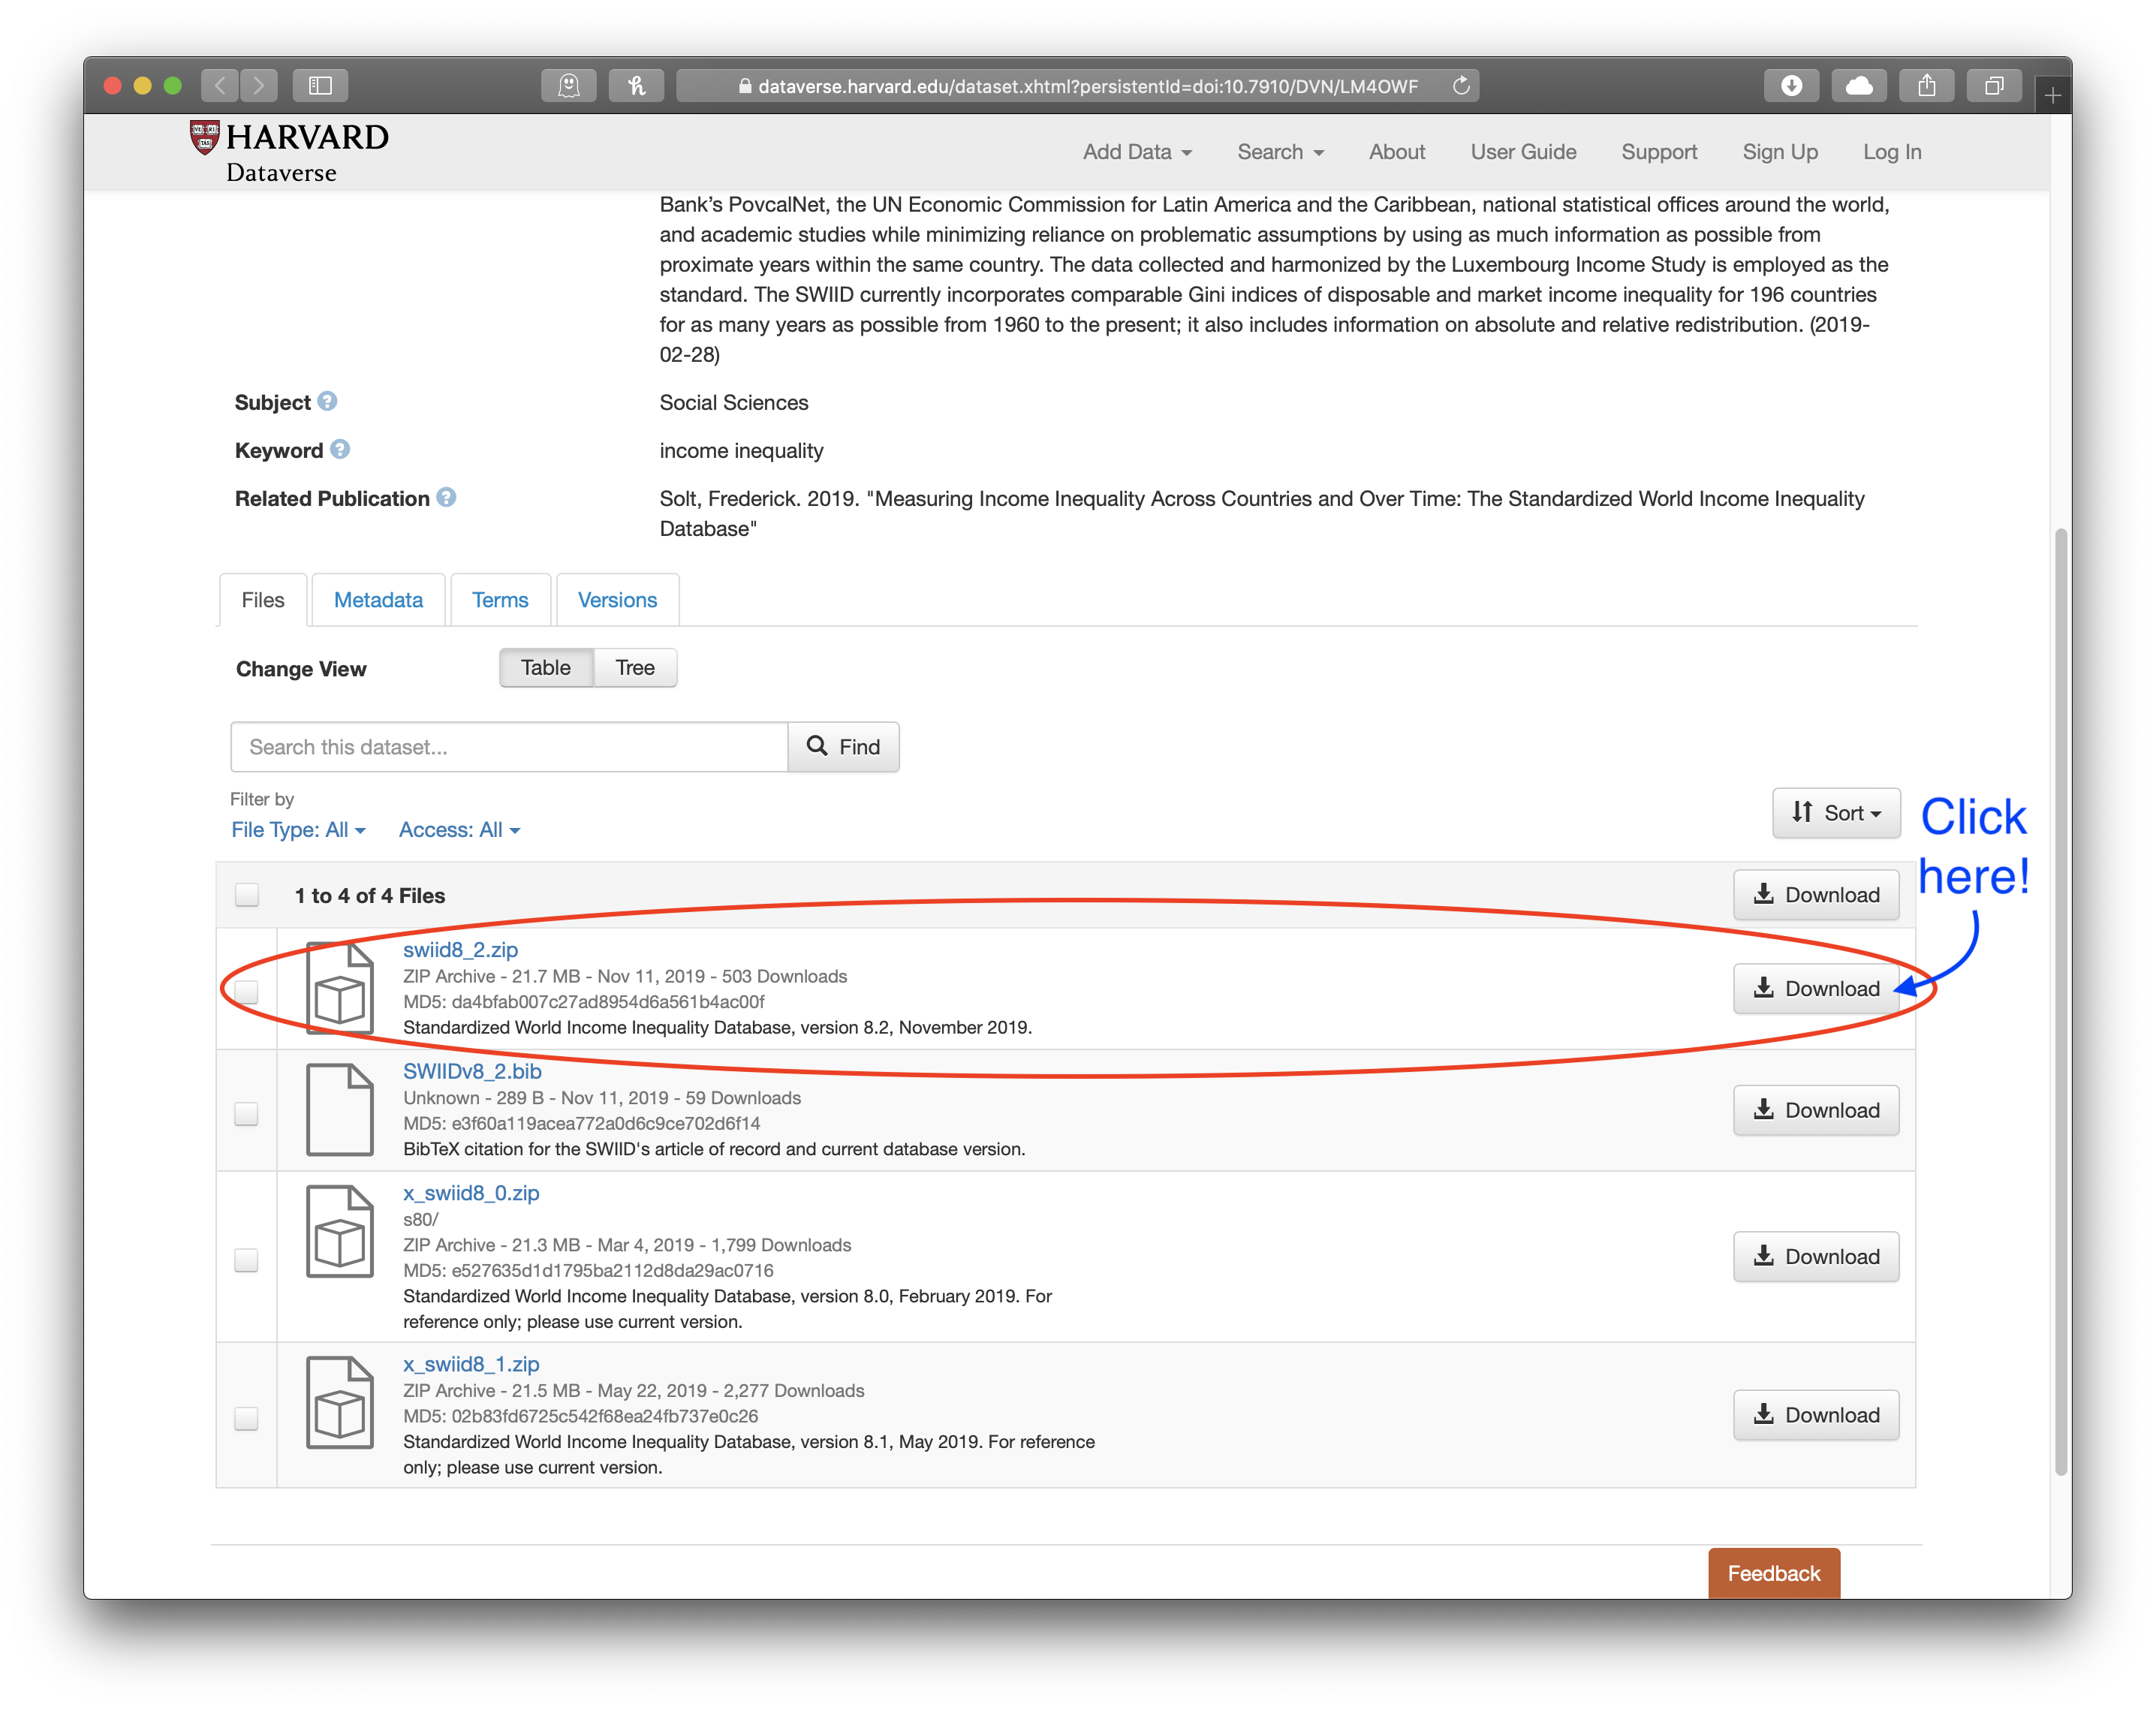
Wait, how can I download the data again?

First, click on this link. Scroll down past the description until you see a list of files. The dataset is a .zip file, the first one labeled “2. Data” (see the screenshot below). Clicking on the big rectangular button labeled “Download” on the right side of this line will download the file.

How can I use the SWIID data to make my own graphs?

The SWIID download contains files pre-formatted for use with the tools for analyzing multiply-imputed data and other data measured with uncertainty in Stata (swiid8_2.dta) or R (swiid8_2.rda). This is meant to “set the default” in a way that encourages researchers to take into account the uncertainty in the SWIID estimates. This uncertainty is considerable in many developing countries, and the tools available in both software packages can now handle pretty much any analysis one may desire (for details, read the documents R_swiid.pdf and stata_swiid.pdf in the SWIID download). But this format does not lend itself to graphing. For this purpose, use the swiid8_2_summary.csv file, which presents the SWIID estimates in mean-plus-standard-error summary format.

I’m using an older version of Stata, and it won’t open the file. How can I use the SWIID?

Stata 13 introduced a new file format which older versions of Stata can’t open. Fortunately, there’s an easy fix: the use13 command. In the command window, first type ssc install use13 to install it. Then you can type use13 SWIIDv5_0.dta, clear to load the SWIID data.

How can I merge my other data into the SWIID using country codes?

First, add whatever country codes are needed to the SWIID data: there are routines for both Stata (kountry; type findit kountry in Stata’s command window to install) and R (countrycode, on CRAN) to generate many commonly used country codes. Then follow the instructions for merging data into the SWIID found in the “Using the SWIID.pdf” file included in the data download.

How can I use the SWIID data with Stata’s time-series operators?

To use Stata’s time-series operators (l. , f. , d. , etc.), you must first declare the time and panel variables using tsset, but the SWIID is already mi set, so tsset won’t work. Run the following before merging the rest of your data (called my_data.dta in this example) into the SWIID:

I imported the swiid_summary.csv file, and the data for some countries seem to be given in different units; for example, in one country, gini_disp is 313 and gini_mkt is 33. How can I interpret these data?

The issue here is that the swiid_summary.csv file is saved using RFC 4180 csv conventions, that is, with a dot marking the decimal and a comma separating values. If you are in a locale that observes different conventions—many countries use commas to indicate the decimal and semicolons to separate values—your software’s default settings may not read the data correctly. Be sure to specify the decimal marker and value delimiter appropriately when loading the file: all SWIID values are Gini indices and so fall between zero and one hundred.
No matching items

The SWIID Data

The estimates for Ruritania, among others, have changed since the previous version. Why is that?

There are three reasons why estimates change from one version of the SWIID to the next. The first reason is revisions to the Luxembourg Income Study. As the LIS serves as the standard for SWIID estimates, when Ginis from the LIS change, the SWIID estimates change as well.

How is Germany treated in the SWIID? Where’s East Germany?

As in the LIS, Germany is West Germany only before 1991 and (united) Germany from that point forward. The SWIID includes no estimates for East Germany; I just haven’t found much to include in the source data. If you know of a source for East German Ginis, email me with the details, and I’ll be happy to get it into the next version.

What about Russia and the rest of the former Soviet Union? Yugoslavia? Czechoslovakia? Pakistan? Sudan? Ethiopia? Why are there estimates for successor states before they actually existed?

For countries that have undergone partition, the SWIID estimates for a given year include all of the origin country’s then-current territories. This means that for dates before partition, all of the once united territory is included: estimates for Sudan before 2011, for example, include present-day South Sudan.

Why doesn’t the SWIID include estimates for redistribution for all countries and years?

Although the SWIID includes estimates of disposable income inequality and market income inequality for all of its country-year observations, it does not provide as many estimates of absolute and relative redistribution, even though these could easily be calculated from gini_disp and gini_mkt. The reason has to do with the source data employed to generate the SWIID estimates: redistribution estimates are provided only in countries for which there is source data available on both the distribution of market income and the distribution of disposable income or consumption. For other countries, the figures provided for market and disposable income inequality each represent the best estimate possible for each concept given the available source data, but both estimates are based on the same observations in the source data, and the difference between them reflects only information derived from other countries (see Solt 2016, 1274-1275 (page 12 in the pre-print)). It would therefore be a mistake to treat this difference as indicative of the redistributive effect of the country’s taxes and transfers.
No matching items