Income Inequality Has Increased For Over Two-Thirds of the Global Population
Chrisendo, Daniel, Venla Niva, Roman Hoffmann, Sina Masoumzadeh Sayyar, Juan Rocha, Vilma Sandström, Frederick Solt, and Matti Kummu. Forthcoming. “Income Inequality Has Increased For Over Two-Thirds of the Global Population.” Nature Sustainability.
Abstract
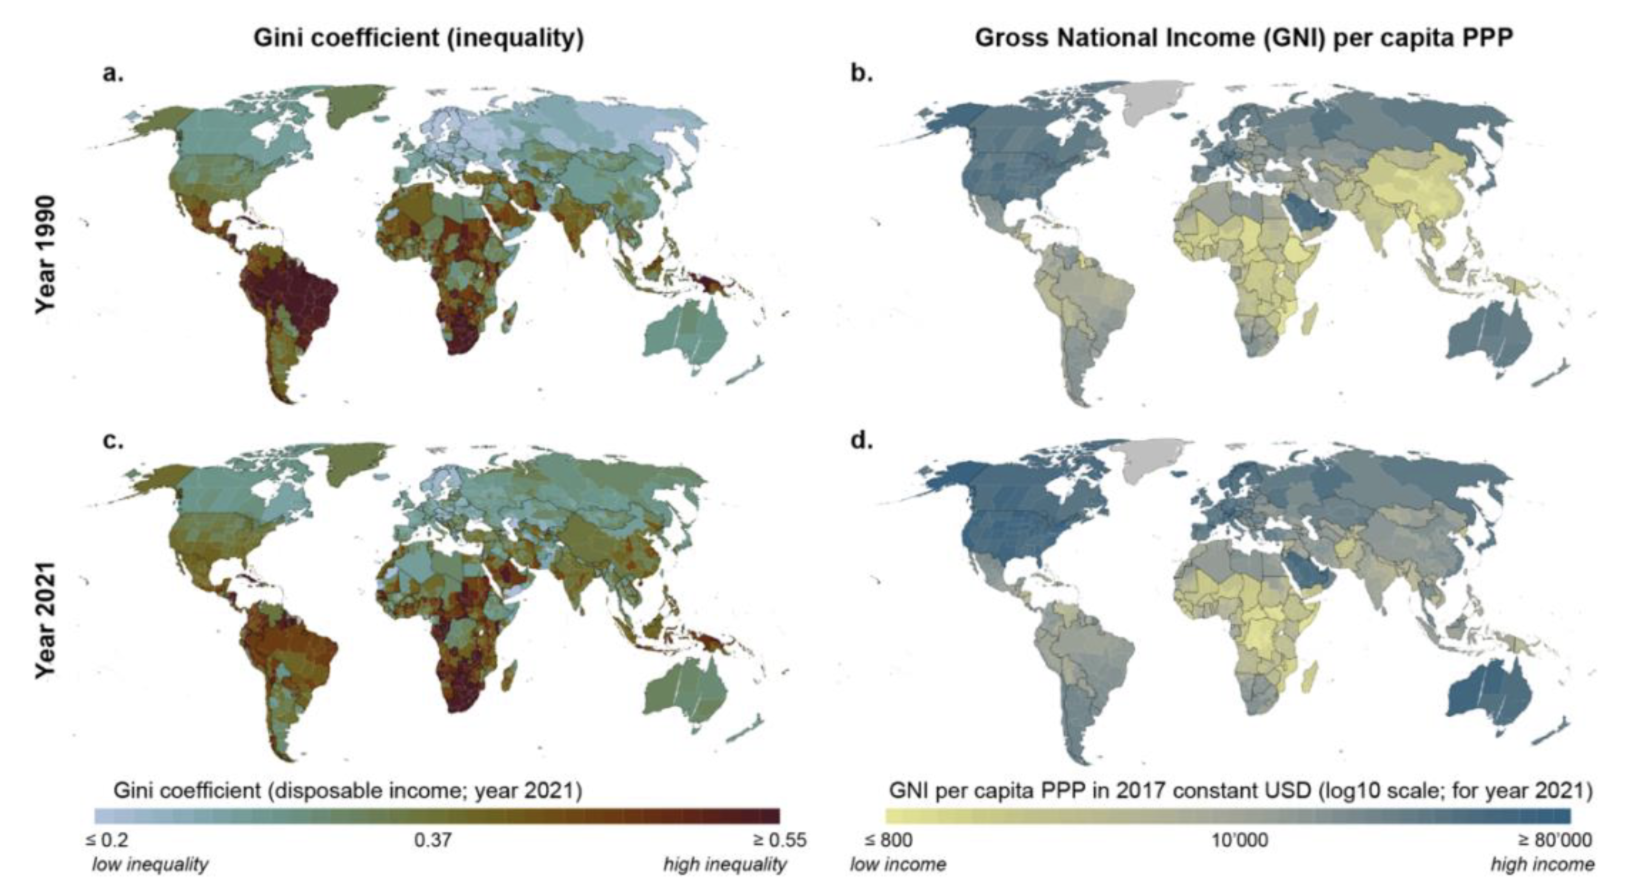
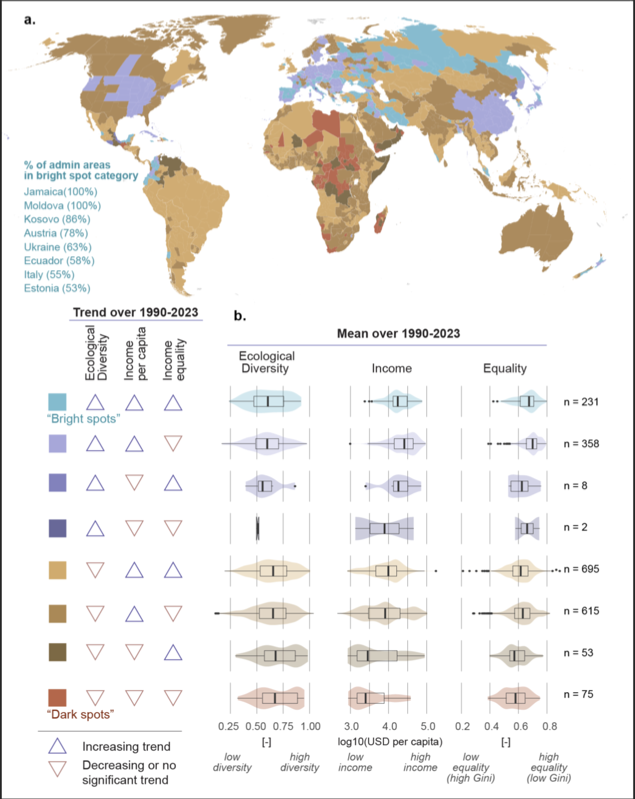
Income inequality is one of the most important measures to indicate economic health, social justice, and quality of life. Yet, especially at the subnational level, comprehensive global data on income distribution are widely missing. Such data are essential for assessing patterns of inequality within countries and their development over time. We created seamless global subnational Gini coefficient and gross national income (GNI) PPP per capita datasets for the period 1990-2023 and used these to assess the status and trends of income inequality and income, as well as their interplay. We show that while gross national income has increased for most people globally (96%), inequality has also increased for around 46-59% (depending on the national dataset used) of the global population, while it has decreased for 31-36% and has not shown significant trend for 10-18%. We illustrate heterogeneities in inequality trends between and within countries, analyse plausible confounding factors related to inequality, and highlight the broad utility of the datasets through a case study that investigates correlations with terrestrial ecological diversity. Our dataset and analyses reveal new insights into the issue, opening novel research avenues at the global, national, and subnational levels and providing comprehensive evidence for policymakers to make informed decisions.
Important figures


BibTeX citation
@misc{Chrisendo2024,
 author={Chrisendo, Daniel and Niva, Venla and Hoffmann, Roman and Masoumzadeh Sayyar, Sina and Rocha, Juan and Sandström, Vilma and Solt, Frederick and Kummu, Matti},
 title={Income Inequality Has Increased For Over Two-Thirds of the Global Population},
 publisher={ResearchSquare},
 year={2024},
 month={Dec},
 url={https://doi.org/10.21203/rs.3.rs-5548291/v1},
 doi={10.21203/rs.3.rs-5548291/v1}
}